This section shows how to make multiplots with the draw package.
Two plots together. The function to be used is draw, which recognizes objects gr2d and gr3d, for 2d and 3d scenes, respectively:
scene1: gr2d(
          title  = "Ellipse",
          nticks = 30,
          parametric(2*cos(t),5*sin(t),t,0,2*%pi))$

scene2: gr2d(
          title  = "Triangle",
          color      = blue,
          fill_color = red,
          polygon([4,5,7],[6,4,2]))$

draw(
  terminal   = svg,
  file_name  = "multi1",
  dimensions = [300, 600],
  scene1,
  scene2)$

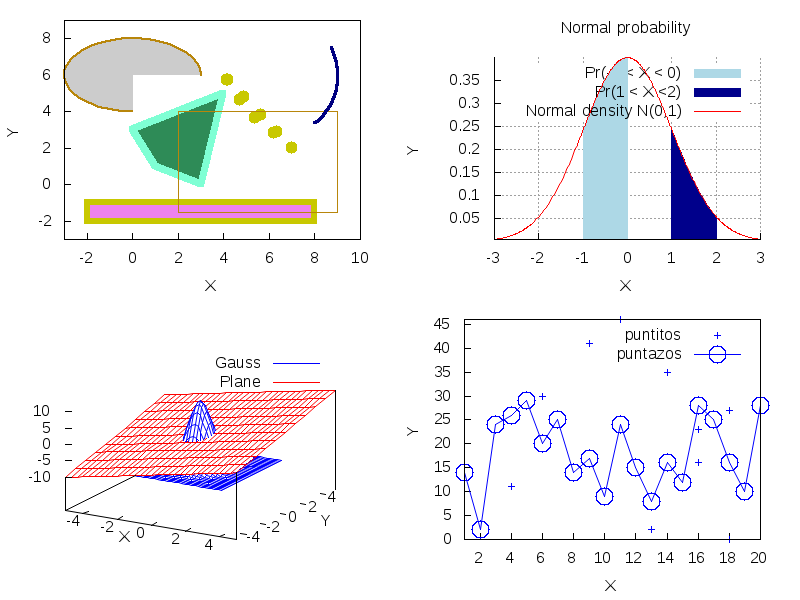
Four plots. By default, the number of columns is 1, but you can change it with option columns:
load(distrib)$

scn1: gr2d(
        fill_color = sea_green,
        color      = aquamarine,
        line_width = 6,
        polygon([[1,1],[3,0],[4,5],[0,3]]),

        transparent = true,
        line_type   = dots,
        color       = dark_yellow,
        polygon([4,5,7],[6,4,2]),

        line_type   = solid,
        transparent = false,
        fill_color  = violet,
        rectangle([-2,-2],[8,-1]),

        transparent = true,
        color       = dark_goldenrod,
        line_width  = 1,
        rectangle([9,4],[2,-1.5]),

        transparent = false,
        fill_color  = grey80,
        line_width  = 2,
        ellipse(0,6,3,2,270,-270),

        transparent = true,
        color       = NaVy,  /* down-upper case doesn't matter */
        line_width  = 3,
        ellipse(7,6,2,3,30,-90),

        xrange      = [-3,10],
        yrange      = [-3,9] )$

scn2: gr2d(
        title       = "Normal probability",
        grid        = true,
        axis_top    = false,
        axis_right  = false,
        filled_func = true,
        fill_color  = light_blue,
        key         = "Pr(-1 < X < 0)",

        explicit(pdf_normal(x,0,1),x,-1,0),
        key         = "Pr(1 < X <2)",
        fill_color  = dark_blue,
        explicit(pdf_normal(x,0,1),x,1,2),
        filled_func = false,
        color       = red,
        key         = "Normal density N(0,1)",
        explicit(pdf_normal(x,0,1),x,-3,3)  )$

scn3: gr3d(
        key          = "Gauss",
        color        = blue,
        explicit(20*exp(-x^2-y^2)-10,x,-3,3,y,-3,3),
        yv_grid      = 10,
        color        = red,
        key          = "Plane",
        explicit(x+y,x,-5,5,y,-5,5),
        surface_hide = true)$

scn4: gr2d(
        key           = "puntitos",
        points(makelist([random(20),random(50)],k,1,10)),
        point_type    = 6,
        point_size    = 3,
        points_joined = true,
        color         = blue,
        key           = "puntazos",
        points(makelist(k,k,1,20),makelist(random(30),k,1,20))) $

draw(
  terminal   = png,
  file_name  = "multi2",
  columns    = 2,
  dimensions = [800,600],
  scn1, scn2, scn3, scn4)$
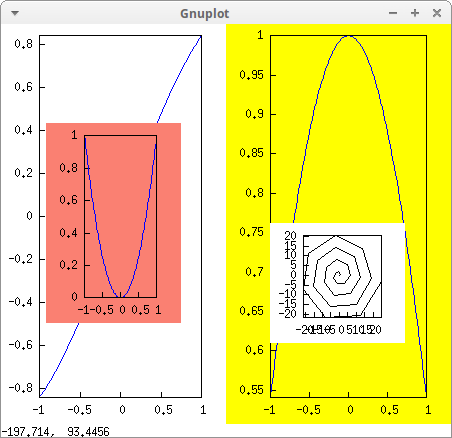
Allocation of plots on arbitrary positions:
draw(
  columns    = 2,
  dimensions = [450,400],

  gr2d(
    explicit(sin(x), x, -1, 1)),

  gr2d(
    background_color = salmon,
    allocation       = [[0.1,0.25], [0.3,0.5]],
    explicit(x^2, x, -1, 1)),

  gr2d(
    background_color = yellow,
    explicit(cos(x), x, -1, 1)),

  gr2d(
    allocation = [[0.6,0.2], [0.3,0.3]],
    color      = black,
    parametric(u*cos(u),u*sin(u), u, 0, 25)) )$
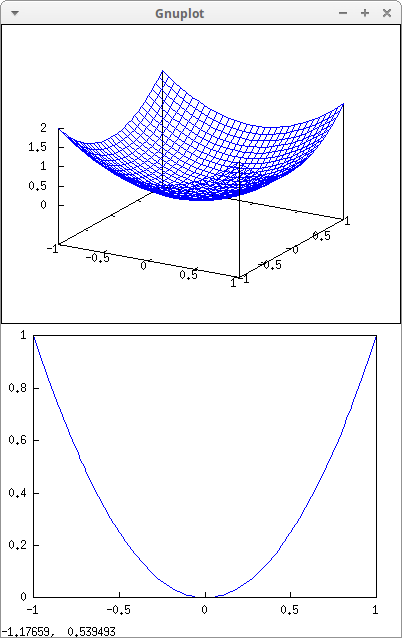
Combining 3D and 2D graphics in one window:
draw(
  dimensions = [400,600],
  gr3d(explicit(x^2+y^2, x, -1, 1, y, -1, 1)),
  gr2d(explicit(x^2, x, -1, 1)) )$
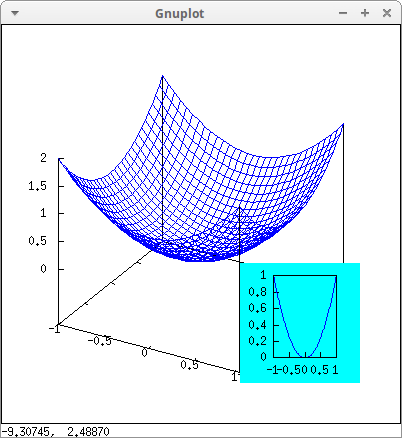
3D and 2D scenes with arbitrary positioning:
draw(
  dimensions = [400,400],
  gr3d(
    explicit(x^2+y^2, x, -1, 1, y, -1, 1)),
  gr2d(
    allocation       = [[0.6,0.10], [0.3,0.3]],
    background_color = cyan,
    explicit(x^2, x, -1, 1)) )$
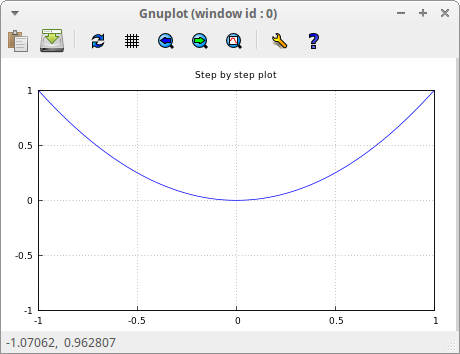
With multiplot_mode you can sequentially add various plots on the same window. In this example we also use function set_draw_defaults to save typewriting. While in multiplot mode, option terminal remains blocked until you type multiplot_mode(none):
/* common options for the next plots */
set_draw_defaults(
   xrange = [-1,1],
   yrange = [-1,1],
   grid   = true,
   title  = "Step by step plot" )$

/* activate multiplot mode */
multiplot_mode(wxt)$

/* 1st plot */
draw2d(color=blue,  explicit(x^2,x,-1,1))$
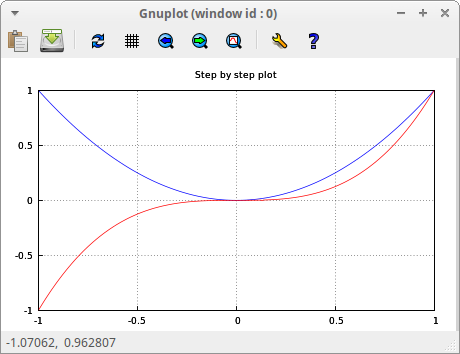
/* 2nd plot */
draw2d(color=red,   explicit(x^3,x,-1,1))$
/* 3rd plot */
draw2d(color=brown, explicit(x^4,x,-1,1))$
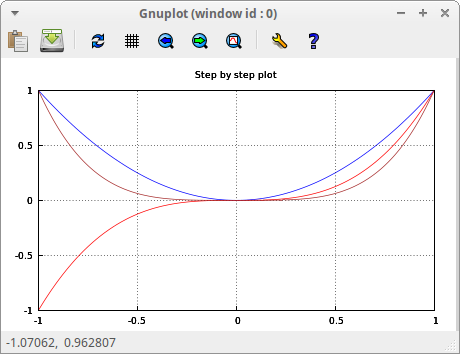
/* don't forget to restore normal mode */
multiplot_mode(none)$
© 2011-2016, TecnoStats.