Once you have opened a Maxima session, load package draw:
load("draw") $
To read the documentation on object polar, write the following sentence:
describe(polar) $
Two functions defined in polar coordinates:
draw2d(
  terminal   = eps,
  dimensions = 100*[10,10],
  grid       = true,
  nticks     = 300,
  line_type  = solid,
  key        = "Rhodonea curve",
  polar(5*sin(10*theta),theta,0,%pi*2),
  line_type  = dots,
  key        = "Fermat spiral",  /* don't write "Fermat's" !! */
  polar(sqrt(theta),theta,0,10*%pi),
  key        = "",       /* we avoid two equal entries in legend */
  polar(-sqrt(theta),theta,0,10*%pi) )$

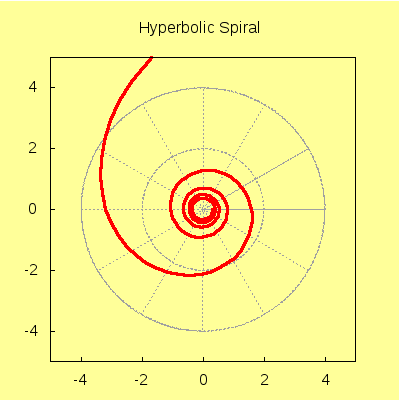
Option grid = true makes reference to a rectangular grid on the plane. If we are plotting a function in polar coordinates, maybe we prefere a polar grid. In this case, option user_preamble will be of great help:
draw2d(
  terminal         = png,
  background_color = "#ffff99",
  dimensions       = [400,400],
  file_name        = "polargrid",
  user_preamble    = "set grid;set grid polar",
  nticks           = 200,
  xrange           = [-5,5],
  yrange           = [-5,5],
  color            = red,
  line_width       = 3,
  title            = "Hyperbolic Spiral",
  polar(10/theta,theta,1,10*%pi) )$
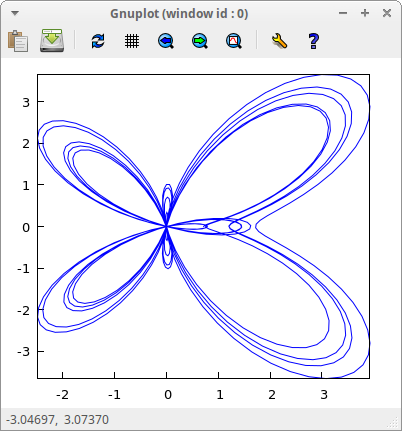
Butterfly:
draw2d(
   terminal = wxt,
   nticks   = 600,
   polar(exp(cos(t))-2*cos(4*t)+sin(t/12)^5,
         t, 0, 30)  )$
© 2011-2016, TecnoStats.