Once you have opened a Maxima session, load package draw:
load("draw") $
To read the documentation on object rectangle, write the following sentence:
describe(rectangle) $
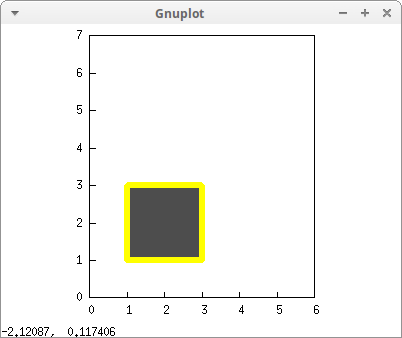
An opaque square:
draw2d(
  fill_color        = gray30,
  color             = yellow,
  line_width        = 6,
  proportional_axes = xy,
  xrange            = [0,6],
  yrange            = [0,7],
  rectangle([1,1],[3,3]) )$
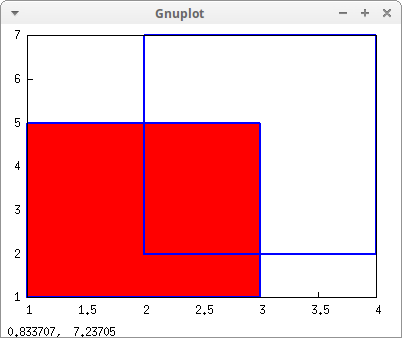
Opaque and transparent squares:
draw2d(
  line_width        = 2,
  rectangle([1,1],[3,5]),
  transparent       = true,
  rectangle([2,2],[4,7]))$
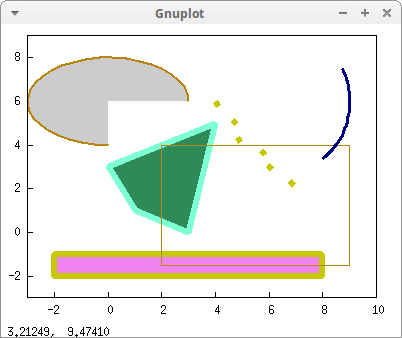
Ellipses, polygons and rectangles:
draw2d(
  fill_color = sea_green,
  color      = aquamarine,
  line_width = 6,
  polygon([[1,1],[3,0],[4,5],[0,3]]),

  transparent = true,
  line_type   = dots,
  color       = "dark-yellow",
  polygon([4,5,7],[6,4,2]),

  line_type   = solid,
  transparent = false,
  fill_color  = violet,
  rectangle([-2,-2],[8,-1]),   /* opposite vertices */

  transparent = true,
  color       = dark_goldenrod,
  line_width  = 1,
  rectangle([9,4],[2,-1.5]),

  transparent = false,
  fill_color  = grey80,
  line_width  = 2,
  ellipse(0,6,3,2,270,-270),  /* center (x,y), a, b, start & end in degrees */

  transparent = true,
  color       = NaVy,  /* down-upper case doesn't matter */
  line_width  = 3,
  ellipse(7,6,2,3,30,-90),

  xrange      = [-3,10],
  yrange      = [-3,9] )$
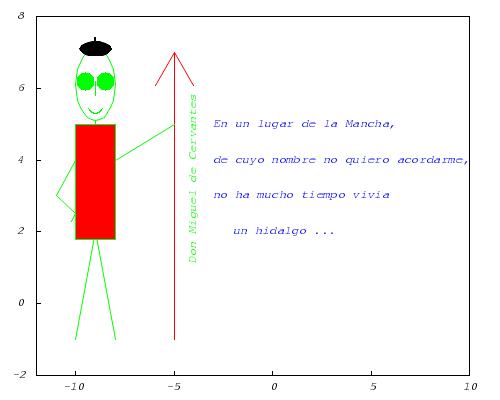
Labels and drawings in 2d:
draw2d(
  /* the text */
  color     = blue,
  font      = "Courier-Oblique",
  font_size = 9,
  label_alignment = left,
  label(["En un lugar de la Mancha,",-3,5]),
  label(["de cuyo nombre no quiero acordarme,",-3,4]),
  label(["no ha mucho tiempo vivia",-3,3]),
  label(["un hidalgo ...",-2,2]),

  /* the author */
  label_orientation = vertical,
  label_alignment   = center,
  color             = green,
  label(["Don Miguel de Cervantes",-4,3.5]),

  /* lance */
  head_type  = nofilled,
  head_angle = 30,
  color      = red,
  vector([-5,-1],[0,8]),

  /* arms and legs */
  color         = green,
  points_joined = true,
  point_size    = 0,
  points([[-10,-1],[-9,2],[-8,-1]]),
  points([[-9,5],[-9,5.1]]),
  points([[-8,4],[-5,5]]),
  points([[-10,4],[-11,3],[-10,2.5],[-10.2,2.3]]),

  /* body */
  fill_color = red,
  rectangle([-10,5],[-8,1.8]),

  /* head */
  transparent = true,
  ellipse(-9,6.1,1,1,0,360),

  /* eyes */
  point_type    = 7,
  points_joined = false,
  point_size    = 3,
  points([[-9.5,6.2],[-8.5,6.2]]),

  /* nose and mouth */
  point_size    = 0,
  points_joined = true,
  points([[-9,6.2],[-9,5.8]]),
  ellipse(-9,5.8,0.5,0.5,225,90),

  /* hat */
  transparent = false,
  fill_color  = black,
  border      = false,
  ellipse(-9,7.1,0.8,0.2,0,360),
  color       = black,
  line_width  = 2,
  points([[-9,7.3],[-9,7.4]]),

  /* global settings */
  xrange     = [-12,10],
  yrange     = [-2,8],
  dimensions = [500,400],
  terminal   = png)$
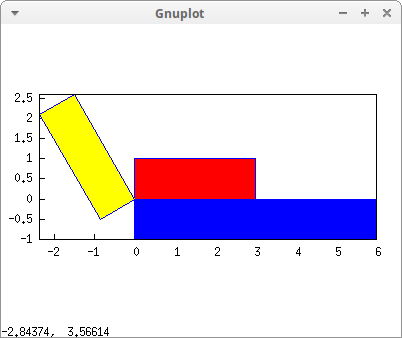
Scaling and rotation:
/* original rectangle */
rect : rectangle([0,0],[3,1])$

/* rotation angle */
th : 2*%pi/3$

draw2d(
   proportional_axes = 'xy,
   fill_color        = red,
   /* original red rectangle */
   rect,

   fill_color        = blue,
   transform         = [x*2,-y,x,y],
   rect,

   fill_color        = yellow,
   transform         = [cos(th)*x - sin(th)*y,
                        sin(th)*x + cos(th)*y, x, y],
   rect )$
© 2011-2016, TecnoStats.