Once you have opened a Maxima session, load package draw and then set global variable draw_renderer to vtk:
load("draw") $
draw_renderer: 'vtk $
To read the documentation on object parametric_surface, write the following sentence:
describe(parametric_surface) $
Two parametric surfaces painted with different palettes:
draw3d(
  palette    = [32,-27,4],
  enhanced3d = u^2+v^2,
  parametric_surface(u,v,u+v,u,-1,1,v,-1,1),

  palette    = gray,
  transform  = [1+2*u, 1-3*v, 1+t^2, u, v, t],
  parametric_surface(u,v,u+v,u,-1,1,v,-1,1) )$
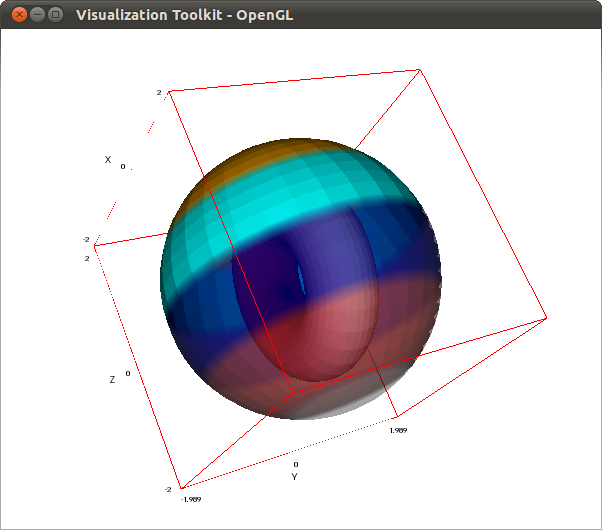
A torus and a partially transparent sphere. We have here also an example of a user defined palette; note that each color in the palette has an associated opacity coefficient:
draw3d(
  enhanced3d = sin(u)+cos(v),
  palette    = [8,4,3],
  parametric_surface(
     sin(u)+.5*sin(u)*cos(v),
     .5*sin(v),
     cos(u)+.5*cos(u)*cos(v),
     u, -%pi, %pi,
     v, -%pi, %pi),

  palette = [[red, 1], [orange, 1], [cyan, 1],
             [navy, 0.7], [brown, 0.6], [black, 0.2]],
  enhanced3d = v,
  parametric_surface(
     2*cos(u)*sin(v),
     2*sin(u)*sin(v),
     2*cos(v),
     u, 0, 2*%pi,
     v, 0,%pi) ) $
Turritella sp. We have removed the axes with option axis_3d and fixed the point of view with view:
draw3d(
  axis_3d = false,
  xu_grid = 100,
  yv_grid = 25,
  view    = [100,20],
  color   = white,
  parametric_surface(
     0.5*u*cos(u)*(cos(v)+1),
     0.5*u*sin(u)*(cos(v)+1),
     u*sin(v) - ((u+3)/8*%pi)^2 - 20,
     u, 0, 13*%pi, v, -%pi, %pi) )$

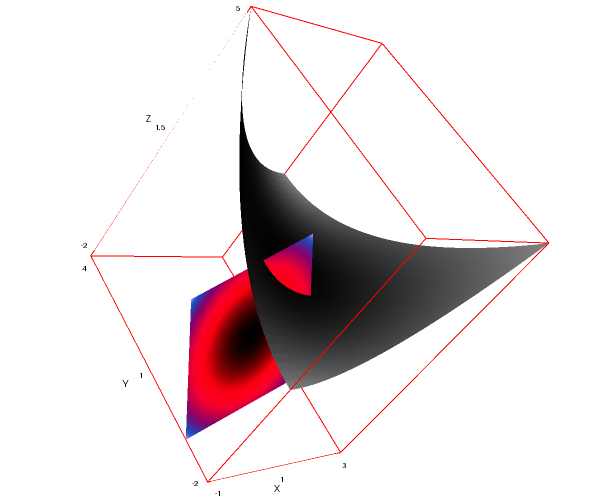
Three surfaces with the same coloring pattern but different palettes. One of the surfaces is transparent:
draw3d(
  enhanced3d = [sin(u^2+v^2),u,v],

  palette = color, /* default */
  parametric_surface(u,cos(v),u+v,u,-3,3,v,-3,3),

  palette = gray,
  parametric_surface(u,cos(v)+4,u+v+2,u,-3,3,v,-3,3),

  palette = [15, 3, -25],
  opacity = 0.7,
  parametric_surface(u,cos(v)+8,u+v+4,u,-3,3,v,-3,3) )$

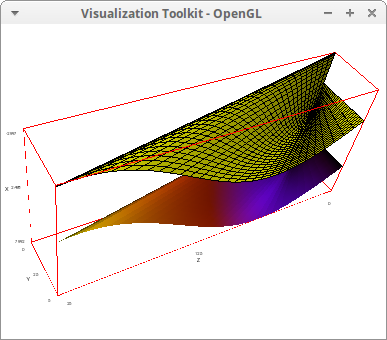
wired_surface with a solid color. This option is local in the VTK interface, but global in Gnuplot:
draw3d(
  wired_surface = true,
  color         = yellow,
  parametric_surface(3*sin(v), u,u*v,u,0,5,v,0,5),
  wired_surface = false,
  enhanced3d    = true,
  parametric_surface(3*sin(v)+5, u,u*v,u,0,5,v,0,5))$
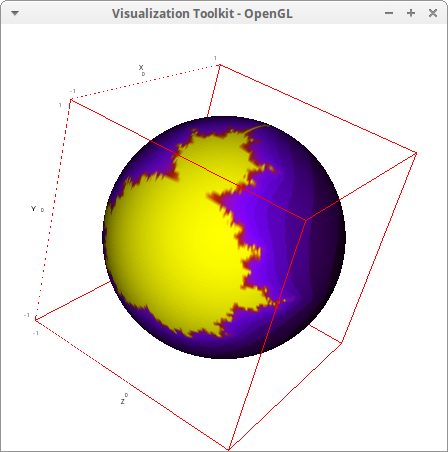
Mandelbrot projection:
load(fractals)$

draw3d(
  xu_grid = 200,
  yv_grid = 200,
  enhanced3d = ['mandelbrot_set(u-%pi,v-%pi/2),u,v],
  parametric_surface(
    cos(u)*sin(v),
    sin(u)*sin(v),
    cos(v), u, 0, 2*%pi, v, 0, %pi))$
The Klein bottle:
x1:6*cos(u)*(1+sin(u)) + 4*(1-0.5*cos(u))*cos(u)*cos(v) $
x2:6*cos(u)*(1+sin(u)) - 4*(1-0.5*cos(u))*cos(v) $
y1:16*sin(u)+4*(1-0.5*cos(u))*sin(u)*cos(v) $
y2:16*sin(u) $
z1:4*(1-0.5*cos(u))*sin(v) $
x : if u<%pi then x1 else x2 $
y : if u<%pi then y1 else y2 $
z : z1;

draw3d(
	enhanced3d=true,
	parametric_surface(x,y,z,u,0,2*%pi,v,0,2*%pi) )$

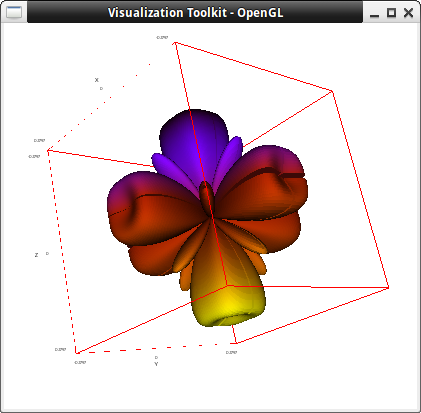
Harmonic 3D function. Thanks to Edward Montague for this nice example:
m0 : 4$
m1 : 3$
m2 : 2$
m3 : 3$
m4 : 6$
m5 : 2$
m6 : 6$
m7 : 4$

eq1: (sin(m0*phi)**m1 + cos(m2*phi)**m3 + sin(m4*theta)**m5 + cos(m6*theta)**m7)$
define(r(theta,phi),eq1)$
r(theta,phi) $

x(theta,phi):=r(theta,phi)*sin(phi) *cos(theta)$
y(theta,phi):=r(theta,phi)*cos(phi)$
z(theta,phi):=r(theta,phi)*sin(phi)*sin(theta)$

draw3d(
  enhanced3d = true,
  palette  = color ,
  xu_grid = 200,
  yv_grid = 200,
  parametric_surface(
          x(theta,phi) ,
          y(theta,phi) ,
          z(theta,phi) ,
      theta, 0,2*%pi,
      phi, 0, %pi ) ) $

Another example from the same author:
AA:0.95$
A1:-AA$
A2:-AA$
A3:-AA$
B1:AA$
B2:AA$
B3:AA$

eq:exp(-%i*%pi*2*(u*x+v*y+w*z))$

eq1:integrate(eq,x,A1,B1)$
eq2:integrate(eq1,y,A2,B2)$
eq3:integrate(eq2,z,A3,B3)$

eq4:realpart(eq3)$
eq4:radcan(eq4)$
eqd:denom(eq4)$
eqn:num(eq4)$
eq4:eqn/(eqd+0.0000001)$

eq5:imagpart(eq3)$
eq5:radcan(eq5)$
eqd:denom(eq5)$
eqn:num(eq5)$
eq5:eqn/(eqd+0.0000001)$

eq7:sqrt(eq4*eq4+eq5*eq5)$

equ:(sin(phi)*cos(theta))$
eqv:(cos(phi))$
eqw:(sin(phi)*sin(theta))$

es1:subst(equ, u, eq7)$
es2:subst(eqv,v,es1)$
es3:subst(eqw,w,es2)$
Pi:ev(%pi,numer)$
es3:subst(Pi,%pi,es3)$

define(r(theta,phi),es3)$

kill(x,y,z)$
x(theta,phi):=r(theta,phi)*sin(phi) *cos(theta)$
y(theta,phi):=r(theta,phi)*cos(phi)$
z(theta,phi):=r(theta,phi)*sin(phi)*sin(theta)$

compile(r,x,y,z)$

draw3d(
  enhanced3d = true,
  palette  = color ,
  xu_grid = 200,
  yv_grid = 200,
  parametric_surface(
          x(theta,phi) ,
          y(theta,phi) ,
          z(theta,phi) ,
      theta, 0,2*Pi,
      phi, 0, Pi
     )
   ) $
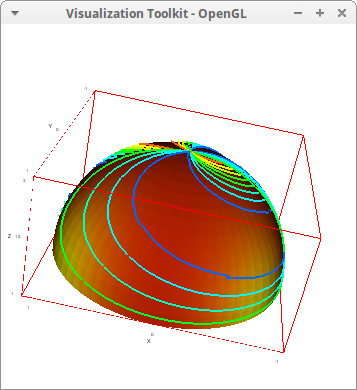
Isolines on a parametric_surface. Also here, we play with isolines and enhanced3d:
draw3d(
    enhanced3d = [x*y*x,x,y,z],
    isolines   = sin(u*v),
    line_width = 4,
    parametric_surface(cos(u)*cos(v),
                       cos(u)*sin(v),
                       1+sin(u), u,0,%pi,v,0,%pi))$
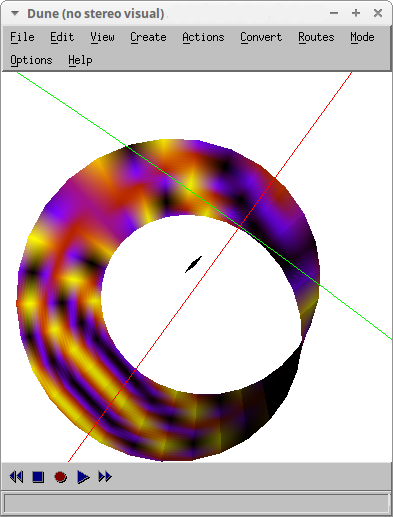
The colored textures originated by enhanced3d is generally lost when exported to a 3D format and then embedded in a html document. In this example, the Moebius band is drawn and exported to a VRML file, the result is then explored with the whitedune viewer:
draw3d(
  axis_3d   = false,
  file_name = "moebius",
  terminal  = vrml,

  enhanced3d = [sin(x+y*z)/50,x,y,z],
  color      = gold,
  parametric_surface(cos(a)*(3+b*cos(a/2)),
                     sin(a)*(3+b*cos(a/2)),
                     5+b*sin(a/2),
                     a,-%pi,%pi,b,-1,1) )$
© 2011-2016, TecnoStats.