Once you have opened a Maxima session, load package draw:
load("draw") $
To read the documentation on object bars, write the following sentence:
describe(bars) $
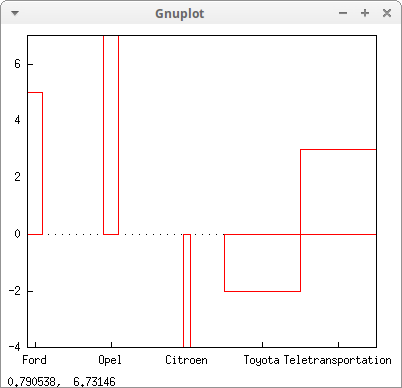
With object bars you can create bars plots and histograms. Arguments are Maxima lists of length three, declaring: the central position on the x-axis, height (positive or negative) and bar width:
draw2d(
  bars([1,5,0.2],[2,7,0.2],[3,-4,0.1],[4,-2,1],[5,3,1]),
  xaxis = true,
  xtics = {["Ford",1],["Opel",2],["Citroen",3],
           ["Toyota",4],["Teletransportation",5]} ) $

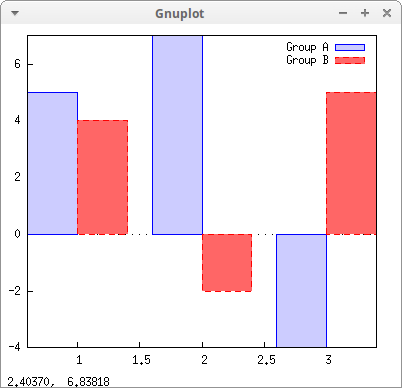
With options fill_color, fill_density and line_width, you can control how to plot bars:
draw2d(
  key          = "Group A",
  fill_color   = blue,
  fill_density = 0.2,
  bars([0.8,5,0.4],[1.8,7,0.4],[2.8,-4,0.4]),
  key          = "Group B",
  fill_color   = red,
  fill_density = 0.6,
  bars([1.2,4,0.4],[2.2,-2,0.4],[3.2,5,0.4]),
  xaxis        = true) $

© 2011-2016, TecnoStats.