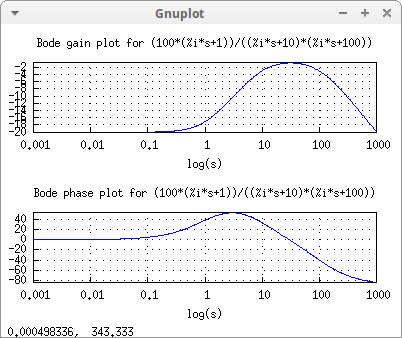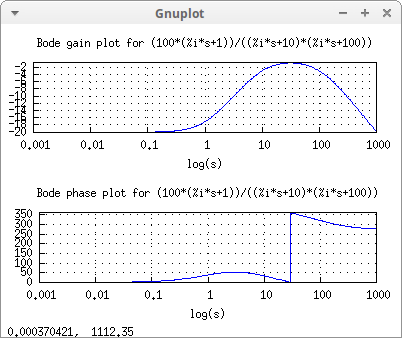
This code is based on Robert Dodier's bode.mac package. It is an adaptation for package draw. Let's define first the necessary functions:
bode_phase_unwrap : false $

log10 (x) := log (x) / log (10) $

carg_unwrapped (z) :=
  block ([a: carg (z)],
    charfun (a < 0) * (2*%pi + a) + (1 - charfun (a < 0)) * a) $

bode (H, var, varmin, varmax) :=
  block ([L],
    L : block ([listdummyvars : false], listofvars (H)),
    if length (L) # 1
      then throw (oops (msg = "bode: failed to identify a unique variable",
                        expr = H, variables = L))
      else s : first (L),
    H : subst (%i * var, var, H),
    draw(

      /* Bode gain plot */
      gr2d(
        title  = concat ("Bode gain plot for ", string (H)),
        logx   = true,
        grid   = true,
        xlabel = concat("log(", var, ")"),
        color  = blue,
        explicit(10 * log10 (cabs (H * conjugate (H))), var, varmin, varmax)),

      /* Bode phase plot */
      gr2d(
        title  = concat ("Bode phase plot for ", string (H)),
        logx   = true,
        grid   = true,
        xlabel = concat("log(", var, ")"),
        color  = blue,
        if bode_phase_unwrap
          then explicit(180/%pi * carg_unwrapped (H), var, varmin, varmax)
          else explicit(180/%pi * carg (H), var, varmin, varmax) ) )) $
Plotting diagrams:
H1 (s) := 100 * (1 + s) / ((s + 10) * (s + 100));
H1(s):=100(s+1)(s+10)(s+100)
bode (H1 (s), s, 1/1000, 1000) $

bode_phase_unwrap : true $
bode (H1 (s), s, 1/1000, 1000) $

© 2011-2016, TecnoStats.