
Once you have opened a Maxima session, load package draw:
load("draw") $
To read the documentation on object ellipse, write the following sentence:
describe(ellipse) $
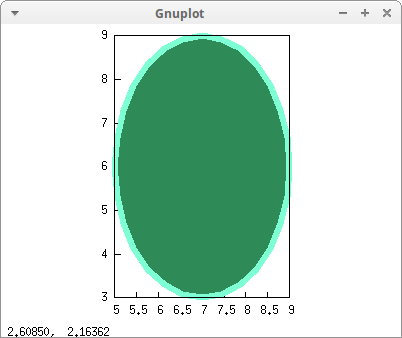
An ellipse with a border:
draw2d(
  proportional_axes = xy,
  fill_color        = sea_green,
  color             = aquamarine,
  line_width        = 6,
  ellipse(7,6,2,3,0,360))$
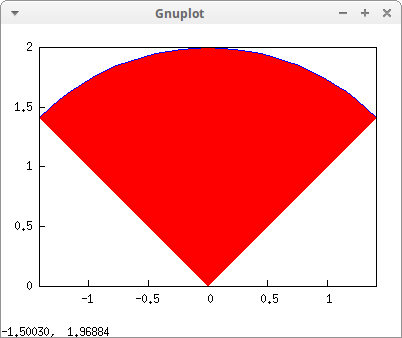
A quarter of a circle, starting at 45 degrees:
draw2d(
  proportional_axes = xy,
  ellipse(0,0,2,2,45,90))$
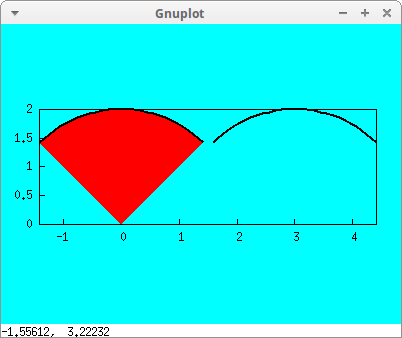
Ellipsoidal arcs:
draw2d(
  line_width        = 2,
  color             = black,
  background_color  = cyan,
  proportional_axes = xy,

  ellipse(0,0,2,2,45,90),

  transparent       = true,
  ellipse(3,0,2,2,45,90))$
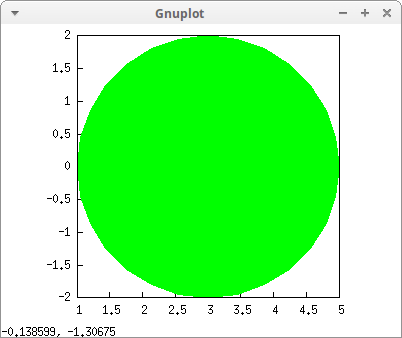
No border:
draw2d(
  border            = false,
  fill_color        = green,
  proportional_axes = xy,
  ellipse(3,0,2,2,0,360))$
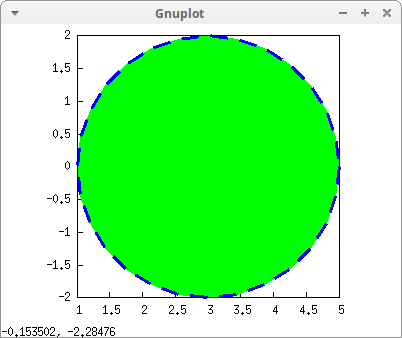
Border type:
draw2d(
  color             = blue,
  line_width        = 3,
  line_type         = dashes,
  fill_color        = green,
  proportional_axes = xy,
  ellipse(3,0,2,2,0,360))$
Pie chart:
random_color():=
  block([obase : 16, col : "#"],
    for i : 1 thru 6 do
       col : concat(col,
                    block([sz : concat(random(16))],
                          substring(sz, slength(sz)))),
    col)$

sectorchart(tit, [pairs]):=
   block([n:length(pairs), items, freqs, degrees, sectors, ini, end:0,
          conver:float(%pi/180), alpha, hexcolor, numer:true],
      items: map('first, pairs),
      freqs: map('second, pairs),
      degrees: 360.0 * freqs / apply("+", freqs),
      header:['title   = tit,
              'xrange  = [-1.5,1.5],
              'yrange  = [-1.5,1.5],
              'xtics   = false,
              'ytics   = false ],
      sectors: makelist((ini: end,
                         end: ini + degrees[i],
                         alpha: ini+degrees[i]/2.0,
                         hexcolor: random_color(),
                         [ fill_color = hexcolor,
                           ellipse(0,0,1.5,1.5,ini,degrees[i]),
                           label([items[i],
                                  1.5*cos(alpha*conver),
                                  1.5*sin(alpha*conver)]),
                           color = black,
                           proportional_axes = xy ])
                        ,i,1,n),
      apply(draw2d,append(header,flatten(sectors)))  )$

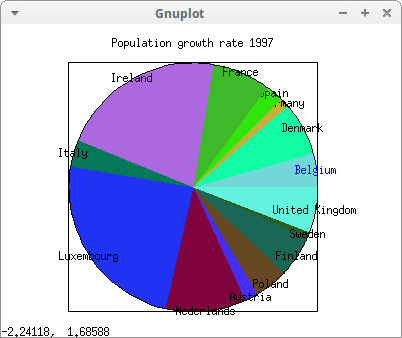
sectorchart(
    "Population growth rate 1997",
    ["Belgium",2.3],
    ["Denmark",3.7],
    ["Germany",0.6],
    ["Spain",1.3],
    ["France",4.0],
    ["Ireland",11.4],
    ["Italy",1.8],
    ["Luxembourg",12.8],
    ["Nederlands",5.6],
    ["Austria",0.9],
    ["Poland",2.3],
    ["Finland",2.9],
    ["Sweden",0.4],
    ["United Kingdom",3.1] )$
Crazy transformation:
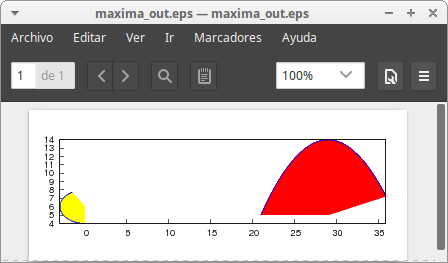
elipse : ellipse(0,6,3,2,270,-150)$
th : %pi/2$

draw2d(
   terminal          = eps_color,
   dimensions        = 100*[10,4],
   proportional_axes ='xy,
   fill_color        = red,
   transform         = [3*cos(th)*x + 4*y + 5,
                        x^2 + 5*cos(th)*y + 5, x, y],
   elipse,

   /* the yellow ellipse is the original one,
      option transform is now set to none */
   fill_color        = yellow,
   transform         = none,
   elipse )$
© 2011-2016, TecnoStats.