
Once you have opened a Maxima session, load package draw:
load("draw") $
To read the documentation on object errors, write the following sentence:
describe(errors) $
We set some default options for these examples:
set_draw_defaults (
   dimensions = [400, 250],
   xrange     = [0,20],
   yrange     = [-5,10],
   grid       = true ) $
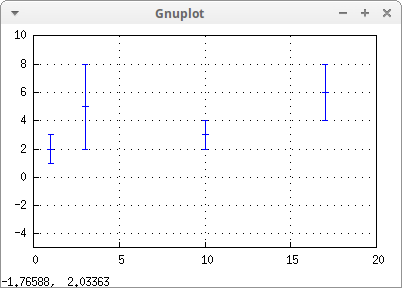
Vertical error bars:
draw2d(
  error_type = y,
  errors([[1,2,1], [3,5,3], [10,3,1], [17,6,2]])) $
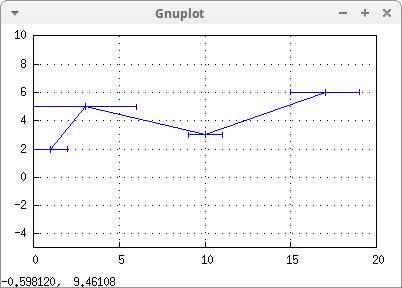
Horizontal error bars with points joined by segments:
draw2d(
  points_joined = true,
  error_type    = x,
  errors([[1,2,1], [3,5,3], [10,3,1], [17,6,2]])) $
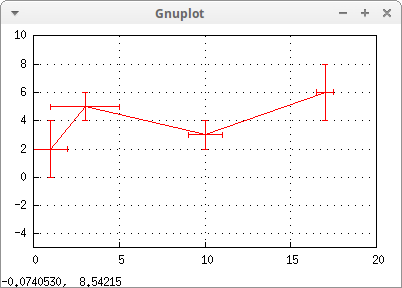
Vertical and horizontal colored error bars:
draw2d(
  error_type    = xy,
  points_joined = true,
  color         = red,
  errors([[1,2,1,2], [3,5,2,1], [10,3,1,1], [17,6,1/2,2]]))$
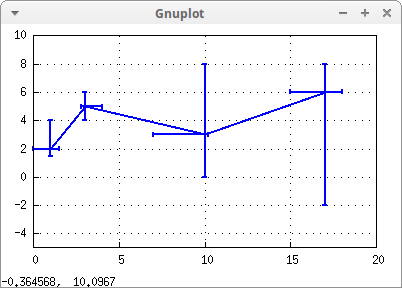
Non centered error bars:
draw2d(
  error_type    = xy,
  points_joined = true,
  line_width    = 2,
  errors([[1,2,0,1.5,1.5,4],
           [3,5,2.8,4,4,6],
           [10,3,7,10.2,0,8],
           [17,6,15,18,-2,8]])) $
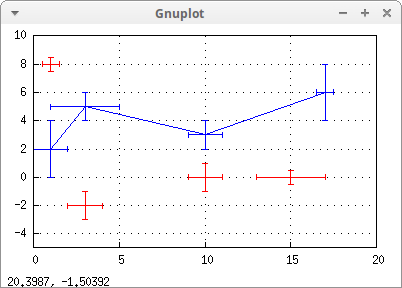
Two samples:
draw2d(
  error_type    = xy,

  /* 1st sample */
  points_joined = true,
  errors([[1,2,1,2], [3,5,2,1], [10,3,1,1], [17,6,1/2,2]]),

  /* 2nd sample */
  color         = red,
  points_joined = false,
  errors([[1,8,1/2,1/2], [3,-2,1,1], [10,0,1,1], [15,0,2,1/2]])) $
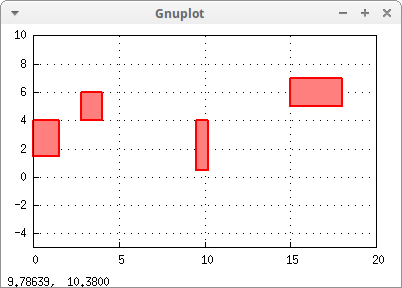
With boxes, instead of two orthogonal bars. Note that points_joined has no effect with boxes:
draw2d(
  error_type    = boxes,
  points_joined = true,
  line_width    = 2,
  color         = red,
  fill_density  = 0.5,
  errors([[1,2,0,1.5,1.5,4],
           [3,5,2.8,4,4,6],
           [10,3,9.5,10.2,0.5,4],
           [17,6,15,18,5,7]])) $
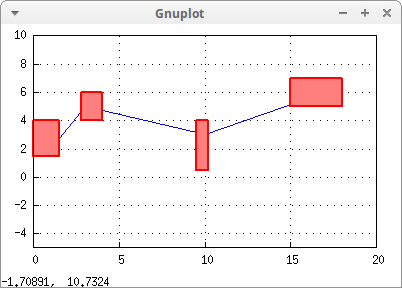
As before, but with joined points:
my_data_and_errors:
    [[1,2,0,1.5,1.5,4],
     [3,5,2.8,4,4,6],
     [10,3,9.5,10.2,0.5,4],
     [17,6,15,18,5,7]] $
my_data: makelist([first(s), second(s)], s, my_data_and_errors) $

draw2d(
  /* first, let's plot the segments */
  points_joined = true,
  points(my_data),

  /* second, error boxes */
  error_type    = boxes,
  line_width    = 2,
  color         = red,
  fill_density  = 0.5,
  errors(my_data_and_errors)) $
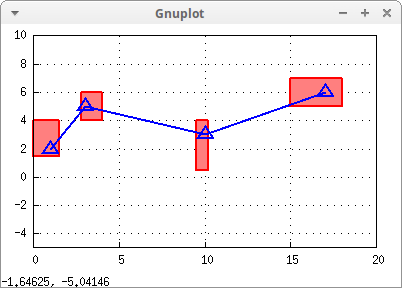
Plotting boxes behind points:
my_data_and_errors:
    [[1,2,0,1.5,1.5,4],
     [3,5,2.8,4,4,6],
     [10,3,9.5,10.2,0.5,4],
     [17,6,15,18,5,7]] $
my_data: makelist([first(s), second(s)], s, my_data_and_errors) $

draw2d(
  /* first, let's plot the boxes */
  error_type   = boxes,
  line_width   = 2,
  color        = red,
  fill_density = 0.5,
  errors(my_data_and_errors),

  /* second, the segments and the points*/
  color         = blue,
  point_size    = 2,
  point_type    = up_triangle,
  points_joined = true,
  points(my_data) ) $
© 2011-2016, TecnoStats.