Once you have opened a Maxima session, load package draw:
load("draw") $
To read the documentation on object label, write the following sentence:
describe(label) $
Label in 2D plots:
draw2d(
  yrange = [0.1,1.4],

  color  = red,
  label(["Label in red",0,0.3]),

  color  = "#0000ff",
  label(["Label in blue",0,0.6]),

  color  = light_blue,
  label(["Label in light-blue",0,0.9],
        ["Another light-blue",0,1.2]) )$

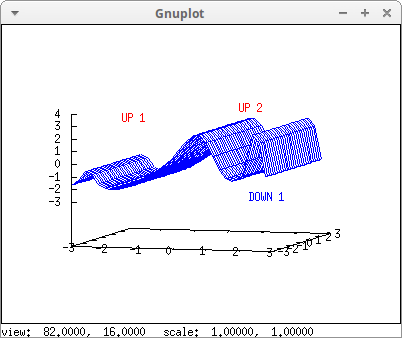
Label in 3D plots:
draw3d(
  surface_hide = true,
  explicit(exp(sin(x)+cos(x^2))-2,x,-3,3,y,-3,3),

  color = red,
  label(["UP 1",-2,0,3], ["UP 2",1.5,0,4]),

  color = blue,
  label(["DOWN 1",2,0,-3]) )$
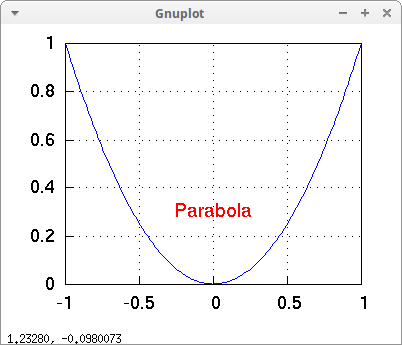
Playing with font type and size in x11 terminal:
draw2d(
  explicit(x^2,x,-1,1),
  grid      = true,

  font      = "Arial",
  font_size = 20,

  color     = red,
  label(["Parabola",0,0.3]) )$
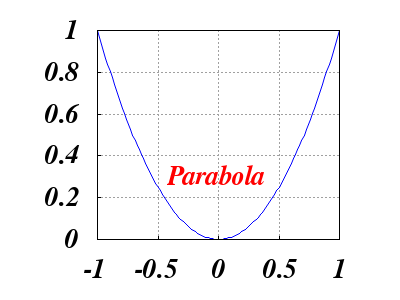
Playing with font type and size in PNG terminal:
draw2d(
  terminal  = png,
  explicit(x^2,x,-1,1),
  grid      = true,

  font      = "/usr/share/fonts/truetype/freefont/FreeSerifBoldItalic.ttf",
  font_size = 20,

  color     = red,
  label(["Parabola",0,0.3]) )$
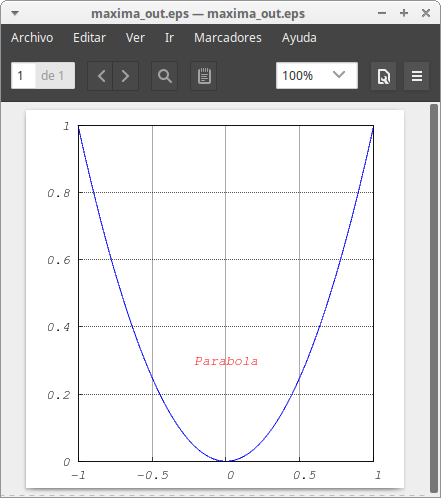
Playing with font type and size in Postscript terminal:
draw2d(
  terminal  = eps_color,
  dimensions = 100*[10,10],
  explicit(x^2,x,-1,1),
  grid      = true,

  font      = "Courier-Oblique",
  font_size = 20,

  color     = red,
  label(["Parabola",0,0.3]) )$
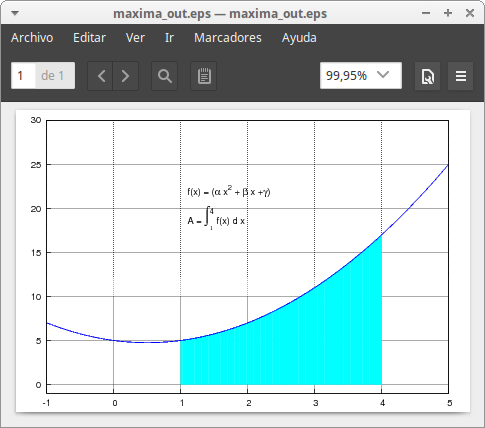
It's possible to write greek letters and some basic mathematical symbols in labels and titles. The syntax to be used is described here:
draw2d(
  dimensions      = 100*[12, 8], /* 12 cm x 8 cm */
  filled_func     = 0,
  fill_color      = cyan,
  explicit(x^2-x+5, x, 1, 4),
  filled_func     = false,
  explicit(x^2-x+5, x, -1, 5),
  color           = black,
  label_alignment = left,
  label(["f(x) = ({/Symbol a} x^2 + {/Symbol b} x +{/Symbol g})", 1.1, 22],
        ["A = {/Symbol=30 \\362@_{/=9.6 1}^{/=12 4}} f(x) d x",1.1,19]),
  yrange          = [-1,30],
  grid            = true,
  terminal        = eps_color ) $
Gif animation with greek characters:
set_draw_defaults(
  xrange          = [1,2.5],
  yrange          = [1,3],
  label_alignment = left )$

greek_word:
  ["{/Symbol P} ",
   "{/Symbol u} ",
   "{/Symbol t} ",
   "{/Symbol a} ",
   "{/Symbol g} ",
   "{/Symbol o} ",
   "{/Symbol r} ",
   "{/Symbol a} ",
   "{/Symbol s} "] $

dynamic_word:
  makelist(
    block([word:""],
      for i:1 thru k do word: concat(word, greek_word[i]),
      gr2d(label([word,1.3,2]))),
    k, 1, length(greek_word)) $

draw(
  delay      = 100,
  file_name  = "greek",
  dimensions = [400, 200],
  terminal   = 'animated_gif,
  dynamic_word  )$
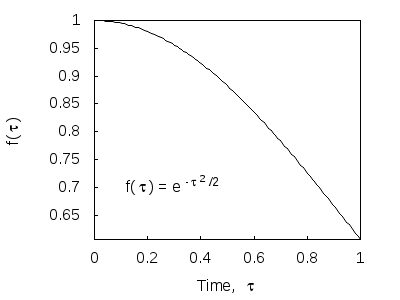
Mathematical expressions in a png file:
draw2d(
  terminal  = png,
  color     = black,
  explicit(exp(-tau^2/2),tau,0,1),
  ylabel    = "f({/Symbol t})",
  xlabel    = "Time,  {/Symbol t}",
  label(["f({/Symbol t}) = e^{-{/Symbol t}^2/2}",0.3,0.7]) ) $
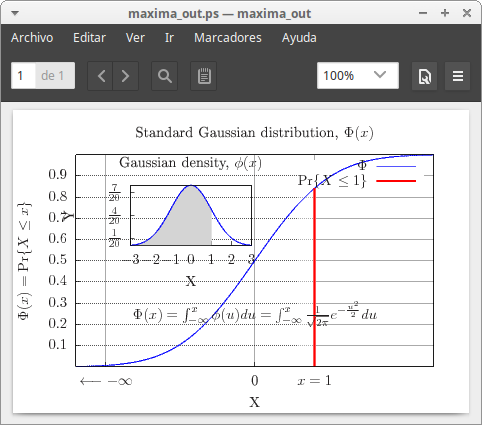
It is possible to write LaTeX code in titles, labels, axes tics and axes labels when working with terminal = epslatex_standalone:
load(distrib) $

/* This code generates two files: maxima_out.tex and maxima_out-inc.eps */
draw(
    terminal = epslatex_standalone,
    dimensions = 100*[12,8],

    gr2d(title      = "Standard Gaussian distribution, $\\Phi(x)$",
         ylabel     = "$\\Phi(x) = \\Pr\\{ X \\leq x\\}$",
         xtics      = {["$\\longleftarrow -\\infty$", -2.5],
                       ["0",0],
                       ["$x=1$",1]},
         grid       = true,
         line_width = 2,
         key        = "$\\Phi$",
         explicit(cdf_normal(x, 0, 1), x, -3, 3),
         label(["$\\Phi(x)=\\int_{-\\infty}^x \\phi(u) du=\\int_{-\\infty}^x \\frac{1}{\\sqrt{2 \\pi}}e^{-\\frac{u^2}{2}}du$",
                 0, 0.25]),
         points_joined = impulses,
         color         = red,
         line_width    = 6,
         key           = "$\\Pr\\{X \\leq 1\\}$",
         points([[1, cdf_normal(1, 0, 1)]])),

    gr2d(allocation  = [[0.1,0.4], [0.5,0.5]],
         title       = "Gaussian density, $\\phi(x)$",
         ytics       = {["$\\frac{1}{20}$",5/100],
                        ["$\\frac{4}{20}$",20/100],
                        ["$\\frac{7}{20}$",35/100]},
         line_width  = 2,
         filled_func = true,
         fill_color  = light_gray,
         explicit(pdf_normal(x,0,1),x,-3,1),
         filled_func = false,
         color       = blue,
         explicit(pdf_normal(x,0,1),x,-3,3) ) ) $

/* Linux command to generate the plot in dvi format */
system("latex maxima_out.tex") $

/* Linux command to generate the plot in Postscript format */
system("dvips maxima_out.dvi -o") $
© 2011-2016, TecnoStats.