Once you have opened a Maxima session, load package draw:
load("draw") $
To read the documentation on object parametric, write the following sentence:
describe(parametric) $
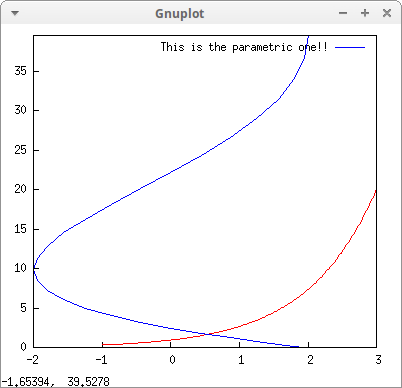
Parametric and explicit functions:
draw2d(
  color = ReD,   /* case insensitive */
  explicit(exp(x),x,-1,3),

  color = "#0000Ff",
  key   = "This is the parametric one!!",
  parametric(2*cos(rrr),rrr^2,rrr,0,2*%pi))$

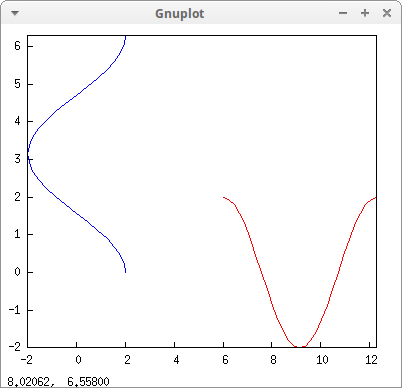
Transforming a parametric function:
para : parametric(2*cos(r),r,r,0,2*%pi) $

draw2d(
   para,
   transform = [v+6,u,u,v],
   color     = red,
   para)$

Parametric 3D curves can be rendered with a colored 4th dimension. This feature is a contribution by Joan Pau Beltran:
draw3d(
   terminal   = wxt,
   color      = blue,
   nticks     = 60,
   line_width = 3,
   enhanced3d = (u-1)^2,
   parametric(cos(5*u)^2,sin(7*u),u-2,u,0,2)) $

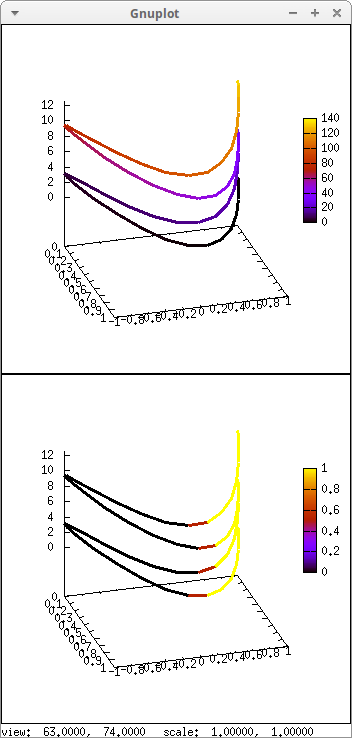
A parametric curve is defined in terms of one parameter; we can define color numbers with respect to it. Also, we can define color numbers in terms of coordinates (x, y, z):
set_draw_defaults(
      nticks     = 60,
      line_width = 3,
      view       = [63,74])$

par_fun: parametric(sin(u)^2,cos(u),u,u,0,4*%pi)$

c1: gr3d(
      /* we can select any parameter name */
      enhanced3d = [(k-1)^2,k],
      par_fun) $

c2: gr3d(
      /* coordinate names are also arbitrary */
      enhanced3d = [if yy>= 0 then 1 else 0, xx, yy, zz],
      par_fun) $

draw(dimensions = [350,700],
     c1,
     c2,
     columns    = 1)$

© 2011-2016, TecnoStats.