
Once you have opened a Maxima session, load package draw:
load("draw") $
To read the documentation on object region, write the following sentence:
describe(region) $
This package plots regions defined by inequalities and boolean operators. Thanks to Prof. Robert Ipanaqué Chero, who brought this algorithm to my attention.
First, let's fix some options for this set of examples:
set_draw_defaults(
  grid              = true,
  proportional_axes = xy) $
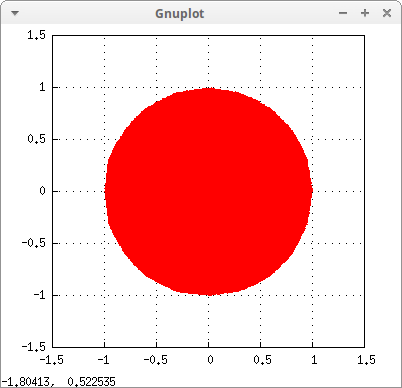
A disc. Red is the default filling color:
draw2d(
   region(x^2+y^2<1 ,x,-1.5,1.5,y,-1.5,1.5)) $
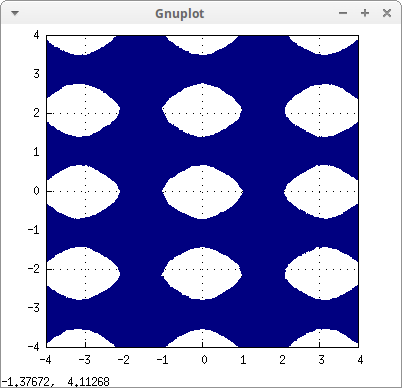
A more complex region:
draw2d(
   x_voxel    = 30,
   y_voxel    = 30,
   fill_color = navy,
   region(cos(2*x)+cos(3*y)<0.5,x,-4,4,y,-4,4)) $
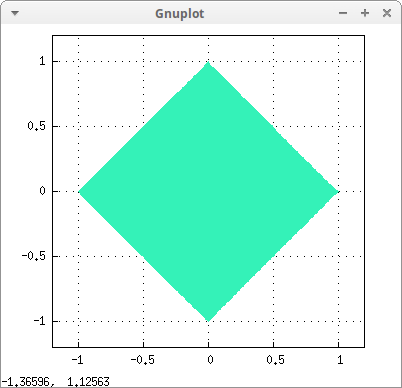
Using abs function:
draw2d(
   fill_color = "#34f2b8",
   region(abs(x)+abs(y)<1.0,x,-1.2,1.2,y,-1.2,1.2)) $
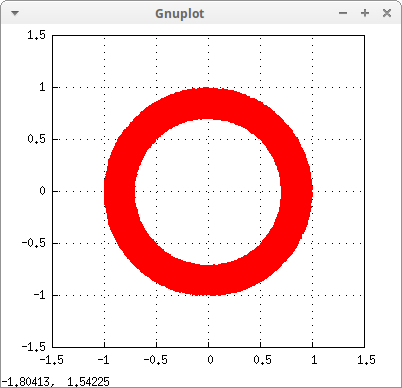
Inequalities with boolean operators:
draw2d(
   x_voxel = 30,
   y_voxel = 30,
   region(x^2+y^2<1 and x^2+y^2 > 1/2,
          x,-1.5,1.5,y,-1.5,1.5)) $
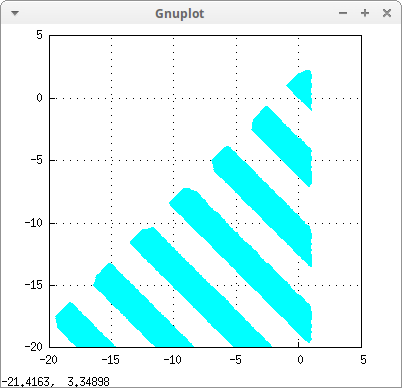
Another example with inequalities:
draw2d(
   x_voxel    = 30,
   y_voxel    = 30,
   fill_color = cyan,
   region(not (x >1 or y > 2+x) and (sin(x+y) > 0),
          x,-20,5,y,-20,5)) $
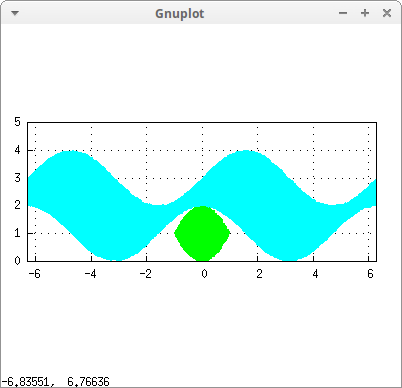
Two different regions:
draw2d(
   x_voxel = 30,
   y_voxel = 30,

   fill_color = green,
   region(y>x^2 and y<2-x^2,x,-2,2,y,0,2),

   fill_color = cyan,
   region(y>cos(x)+1 and y<sin(x)+3,x,-2*%pi,2*%pi,y,0,5))$
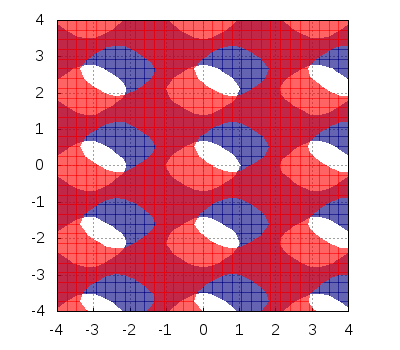
Transparencies are not handled the same way by all supported terminals, that's the reason why there is not a grahics option in the draw package to implement this atribute; use user_preamble instead:
draw2d(
   x_voxel  = 30,
   y_voxel  = 30,
   terminal = png,

   fill_color = navy,
   region(cos(2*x)+cos(3*y)<0.5,x,-4,4,y,-4,4),

   fill_color = red,
   region(sin(2*x)+sin(3*y)<0.5,x,-4,4,y,-4,4),

   user_preamble = "set style fill transparent solid 0.6 noborder" ) $
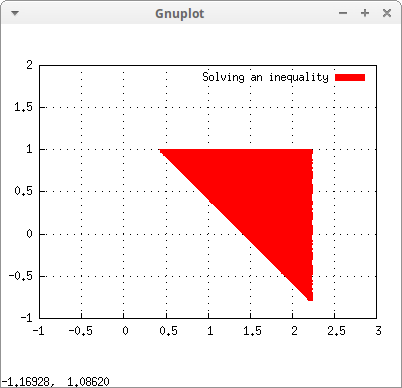
Plotting the solution of an inequality. First, we solve the inequality:
load("fourier_elim") $
sol: fourier_elim([sqrt(2) < x + y, x < sqrt(5), y < 1],[x,y]);
[√2−y<x,x<√5,√2−√5<y,y<1]
Now, we plot the solution:
draw2d(
   key     = "Solving an inequality",
   x_voxel = 50,
   y_voxel = 50,
   region(apply("and", sol) ,x,-1,3,y,-1,2)) $
© 2011-2016, TecnoStats.