Once you have opened a Maxima session, load package draw:
load("draw") $
To read the documentation on object tube, write the following sentence:
describe(tube) $
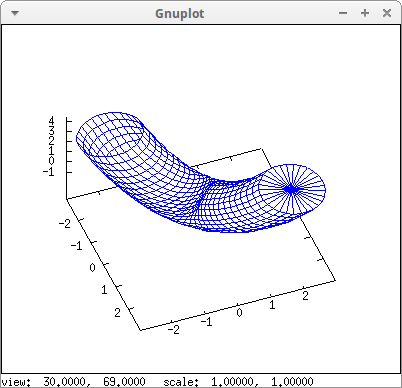
We can select if we want open or closed extremes:
draw3d(
  surface_hide = true,
  capping      = [false, true],
  tube(a, a, a^2, 1, a, -2, 2) )$
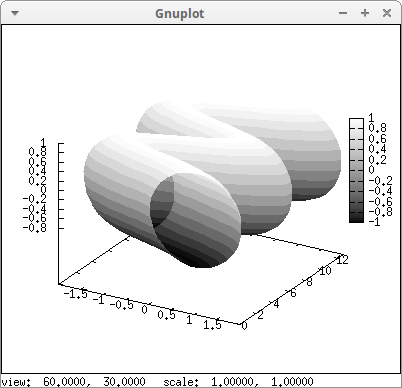
Tubes can be plotted indicating a parametric curve and the radius:
draw3d(
  enhanced3d = true,
  palette    = gray,
  xu_grid    = 50,
  tube(cos(a), a, 0, 1,
       a, 0, 4*%pi) )$
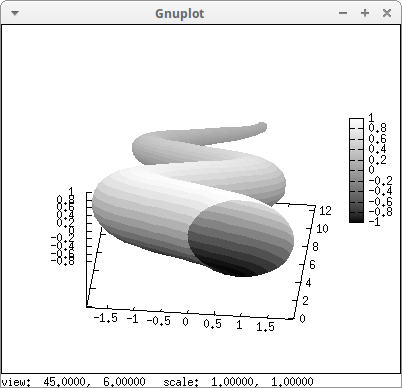
Sinusoidal tube with varying diameter:
draw3d(
  enhanced3d = true,
  palette    = gray,
  xu_grid    = 50,
  tube(cos(a), a, 0, cos(a/10)^2,
       a, 0, 4*%pi) )$
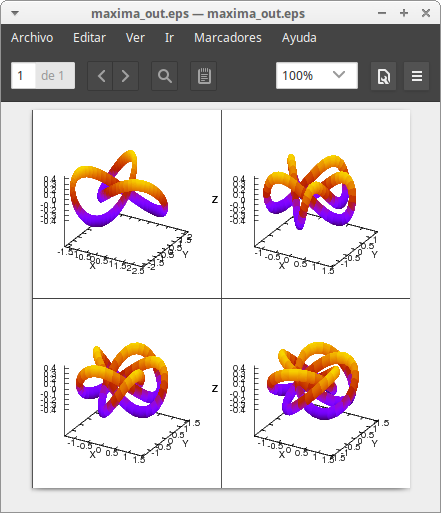
A family of knots:
knot(m,n,h,p,q,t,k,i,r,s) :=
  block([a],
    gr3d(
      xu_grid    = 100,
      enhanced3d = true,
      colorbox   = false,
      tube(m * cos(p*a) + n*cos(q*a) + k*cos(r*a),
           m * sin(p*a) + n*sin(q*a) + k*sin(r*a),
           h * sin(t*a) + i*sin(s*a),
           0.1,
           a, 0, 2*%pi)))$

k1 : knot(1,1.5,0.35,1,-2,3,0,0,0,0) $
k2 : knot(1,0.45,0.35,2,-3,5,0,0,0,0) $
k3 : knot(1,0.45,0.35,3,-2,5,0,0,0,0) $
k4 : knot(1,0.45,0.35,4,-1,5,0,0,0,0) $

draw(
  terminal   = eps_color,
  dimensions = 100*[10,10],
  columns    = 2,
  k1, k2, k3, k4 )$
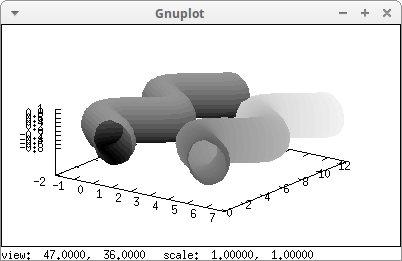
Color scalars for tube objects can be especified with respect to the parameter of the central curve, or with respect to the \((x, y, z)\) coordinates of the surface points:
draw3d(
  colorbox   = false,
  palette    = gray,
  xu_grid    = 50,

  /* wrt the curve parameter */
  enhanced3d = [a,a],
  tube(5+cos(a), a, 0, 1, a, 0, 4*%pi),

  /* wrt the xyz coordinates */
  enhanced3d = [4*z,x,y,z],
  tube(cos(a), a, 0, 1, a, 0, 4*%pi) )$
© 2011-2016, TecnoStats.