
Once you have opened a Maxima session, load package draw:
load("draw") $
To read the documentation on object vector, write the following sentence:
describe(vector) $
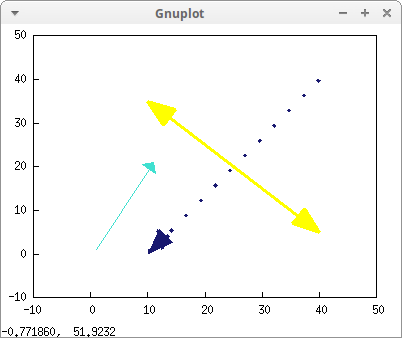
Vectors in 2d:
draw2d(
  xrange   = [-10,50],
  yrange   = [-10,50],
  color    = turquoise,
  vector([1,1],[10,20]),

  head_both   = true,
  head_length = 5,
  line_width  = 3,
  color       = yellow,
  head_angle  = 20,
  vector([40,5],[-30,30]),

  line_type = dots,
  color     = "midnight-blue",
  head_both = false,
  vector([40,40],[-30,-40]))$
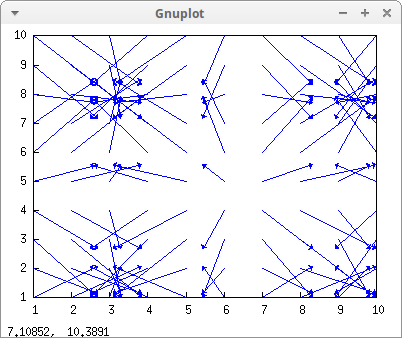
A vector field is plotted as a set of vectors:
/* vector origins are {(x,y)| x,y=1,...,10}  */
coord: setify(makelist(k,k,1,10))$
points2d: listify(cartesian_product(coord,coord))$

/* compute vectors at the given points  */
vf2d(x,y):= vector([x,y],2*[sin(x),cos(y)])$
vect2: makelist(vf2d(k[1],k[2]),k,points2d)$

/* draw the vector field */
draw2d(
  head_length = 0.1,
  vect2)$
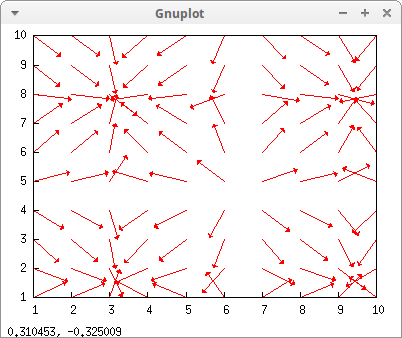
Vectors of unit length:
draw2d(
  head_length  = 0.1,
  color        = red,
  unit_vectors = true,
  vect2)$
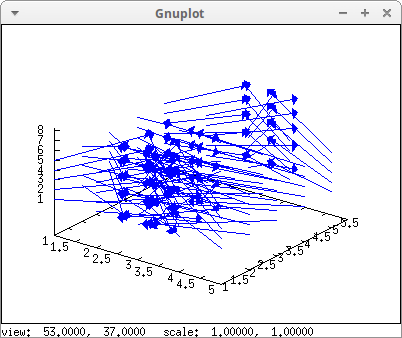
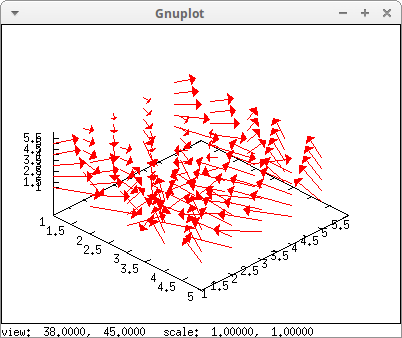
A vector field in 3d:
/* vector origins are {(x,y,z)| x,y=1,...,5}  */
coord: setify(makelist(k,k,1,5))$
points3d: listify(cartesian_product(coord,coord,coord))$

/* compute vectors at the given points  */
vf3d(x,y,z):= vector([x,y,z],2*[sin(x),cos(y),log(z)])$
vect3: makelist(vf3d(k[1],k[2],k[3]),k,points3d)$

/* draw the vector field */
draw3d(
  head_length = 0.1,
  vect3)$
Vectors in 3D of unit length:
draw3d(
  head_length  = 0.1,
  color        = red,
  unit_vectors = true,
  vect3)$
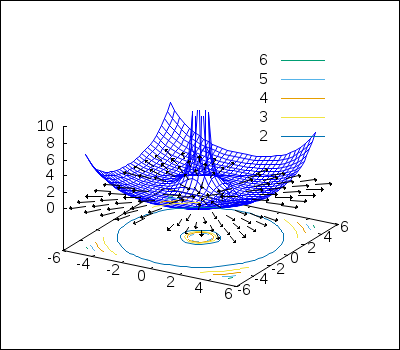
Gradients:
/* Define the surface */
f(x,y):=%e^sqrt(y^2+x^2)/(y^2+x^2)^(4/3) $

/* Calculate the gradients */
load(vect) $
gr: ev(express(grad(f(x,y))),diff) $

/* Set of vector origins.  */
/* Point [0,0] is not used */
coord: {-5,-4,-3,-2,-1,1,2,3,4,5}$
points2d: listify(cartesian_product(coord,coord))$

/* Generate vectors for graphic routines */
define(vf2d(x,y), vector([x,y,0], gr)) $

/* Go ahead! */
draw3d(
  dimensions     = [400,350],
  terminal       = png,

  /* Surface and contours */
  contour        = base,
  contour_levels = [0,1,10],
  explicit(f(x,y),x,-5,5,y,-5,5),

  /* Vector field */
  color          = black,
  unit_vectors   = true,
  head_length    = 0.15,
  makelist(vf2d(k[1],k[2]),k,points2d),

  /* Two global options to play with */
  zrange         = [0,10],
  xyplane        = -5 )$
© 2011-2016, TecnoStats.