We want to plot direction fields of first order differential equations defined by means of dydx=F(x,y), or of {dxdt=G(x,y)dydt=F(x,y)
In both cases, we need to load package drawdf,
load("drawdf")$
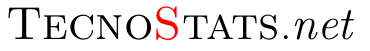
First example is the differential equation dydx=exp(−x)+y, where the independent and dependent variables are x and y, respectively.
drawdf(exp(-x)+y)$
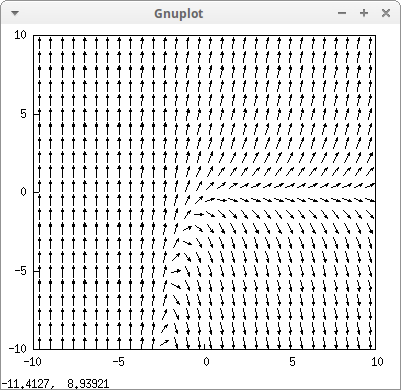
In case we work with other variables, it's necessary to explicitly declare them. For example, the direction field defined by dydt=cos(−t)+y, is plotted as follows,
drawdf(cos(-t)+y, [t,y])$
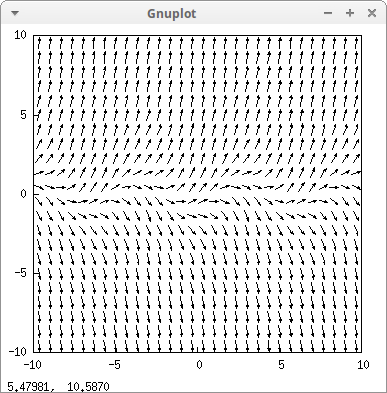
The default plotting range is [−10,10]×[−10,10], but it's possible to change it,
drawdf(cos(-t)+y, [t,0,10], [y,-2,2])$
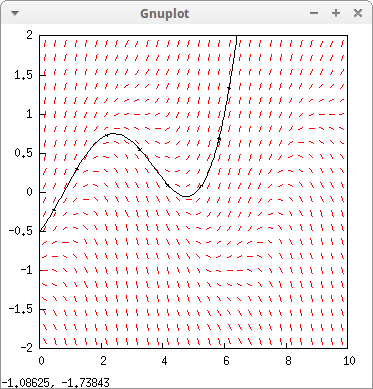
We can add to the direction field the trajectory passing through a particular point, (6,1),
drawdf(
  cos(-t)+y, [t,0,10], [y,-2,2],
  soln_arrows = true,
  soln_at(6,1))$
We can make use of ordinary draw package options to costumize the plot,
drawdf(
  cos(-t)+y, [t,0,10], [y,-2,2],
  line_width       = 3,
  color            = blue,
  solns_at([6,1], [4,-1]),
  color            = yellow,
  background_color = light_gray,
  soln_at(9,-1) ) $

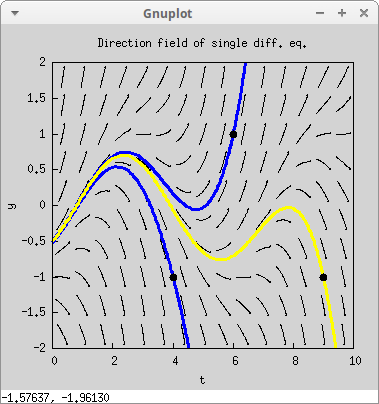
To change the number of columns and rows in the grid, use option field_grid. Also, setting field_degree=2 forces arrows to be substituted by quadratic splines,
drawdf(
  cos(-t)+y, [t,0,10], [y,-2,2],

  field_degree     = 2,
  field_grid       = [15,10],

  line_width       = 3,
  color            = blue,
  solns_at([6,1], [4,-1]),
  color            = yellow,
  background_color = light_gray,
  soln_at(9,-1),

  /* Plot interesting points */
  points_joined = false,
  color = black,
  point_type = filled_circle,
  point_size = 1.5,
  points([[6,1], [4,-1], [9,-1]]),

  /* Labels and title */
  xlabel = "t",
  ylabel = "y",
  title  = "Direction field of single diff. eq.")$
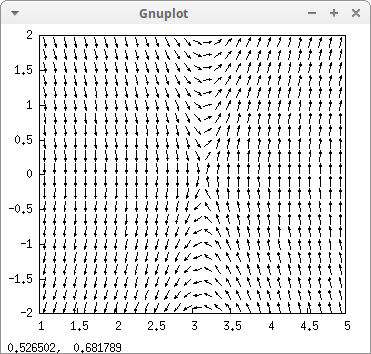
Let's now try the system {dxdt=ydydt=−9sin(x)−y5
drawdf([y,-9*sin(x)-y/5], [x,1,5], [y,-2,2])$
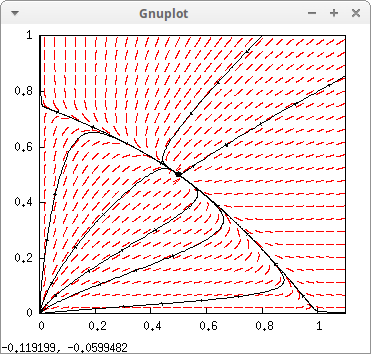
Now, the direction field for {dxdt=x(1−x−y)dydt=y(34−y−x2)
drawdf(
  [x*(1-x-y), y*(3/4-y-x/2)], [x,0,1.1], [y,0,1],
  field_degree = 2,
  duration     = 40,
  soln_arrows  = true,
  point_at(1/2,1/2),
  solns_at([0.1,0.2], [0.2,0.1], [1,0.8], [0.8,1],
           [0.1,0.1], [0.6,0.05], [0.05,0.4],
           [1,0.01], [0.01,0.75]))$
Finally, for more information on package drawdf, write
? drawdf
© 2011-2016, TecnoStats.