Once you have opened a Maxima session, load package draw and then set global variable draw_renderer to vtk:
load("draw") $
draw_renderer: 'vtk $
Explaining latitude and longitude. First, we write function terra:
deg2rad(ang) := float(ang * %pi / 180) $

terra([sitios]) :=
  block([G_lat, tropic, polar, place, lat, lon],
    tropic: deg2rad(23 + 27/60),
    polar: deg2rad(66 + 33/60 + 44/3600),
    G_lat: deg2rad(51 + 28/60 + 38/3600),
    draw3d(
      background_color = black,
      axis_3d          = false,
      color            = blue,
      opacity          = 0.6,
      sphere([0,0,0],1),
      nticks           = 100,
      opacity          = 1,
      color            = white,
      points_joined    = true,
      point_type       = dot,
      points([[0,0,-1.5], [0,0,1.5]]),

      /* Greenwich meridian, Equator, Tropics and Polar Circles */
      parametric(1.01*cos(t),0,1.01*sin(t),t,0,2*%pi),
      parametric(1.01*cos(t),1.01*sin(t),0,t,0,2*%pi),
      line_type        = dashes,
      parametric(1.01*cos(tropic)*cos(t),
                 1.01*cos(tropic)*sin(t),
                 sin(tropic),t,0,2*%pi),
      parametric(1.01*cos(tropic)*cos(t),
                 1.01*cos(tropic)*sin(t),
                 -sin(tropic),t,0,2*%pi),
      parametric(1.005*cos(polar)*cos(t),
                 1.005*cos(polar)*sin(t),
                 sin(polar),t,0,2*%pi),
      parametric(1.005*cos(polar)*cos(t),
                 1.005*cos(polar)*sin(t),
                 -sin(polar),t,0,2*%pi),

      /* labels */
      color            = white,
      font_size        = 0.2,
      label(["N", 0, 0, 1.1],
            ["S", 0, 0, -1.3]),
      font_size        = 0.1,
      label(["Greenwich", cos(G_lat)*1.2, 0, sin(G_lat)*1.2]),
      line_width       = 1,
      line_type        = solid,
      points([[cos(G_lat)*1.2, 0, sin(G_lat)*1.2],
              [cos(G_lat), 0, sin(G_lat)]]),
      color            = yellow,
      line_width       = 3,
      points([[0,0,0], [1, 0, 0]]),
      font_size        = 0.1,

      /* places */
      if length(sitios) > 0
        then makelist(
               (lat: deg2rad(k[2]),
                lon: deg2rad(k[3]),
                place: float([cos(lat)*cos(lon),
                              cos(lat)*sin(lon),
                              sin(lat)]),
                [points([[0,0,0],
                         [place[1]*1.5, place[2]*1.5, place[3]*1.5]]),
                 points([[0,0,0],
                         [place[1], place[2], 0]/sqrt(place[1]^2+place[2]^2)]),
                 parametric(1.01*cos(t)*cos(lon),
                            1.01*cos(t)*sin(lon),
                            1.01*sin(t),
                            t,min(0,lat), max(0,lat)),
                 parametric(1.01*cos(t),
                            1.01*sin(t),
                            0,
                            t,min(0,lon), max(0,lon)),
                   label([k[1], place[1]*1.5, place[2]*1.5, place[3]*1.5])]),
                k, sitios)
        else []))$
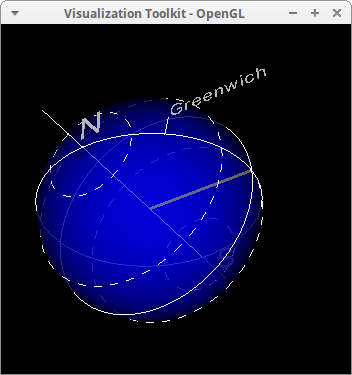
Let's call the function without arguments:
terra() $

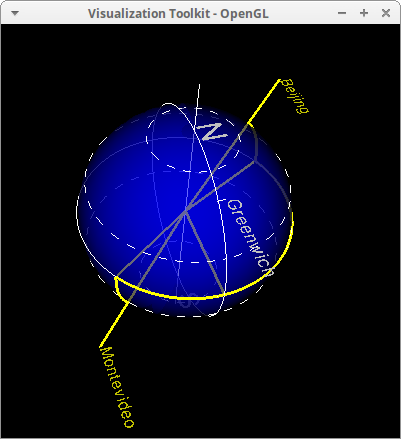
Now, we define some geographic locations and draw their coordinates:
Beijing:    ["Beijing", 39 + 54/60, 116 + 23/60] $
Montevideo: ["Montevideo", -34-53/60, -56-11/60] $

terra(Beijing, Montevideo) $

© 2016, TecnoStats.