Once you have opened a Maxima session, load package draw and then set global variable draw_renderer to vtk:
load("draw") $
draw_renderer: 'vtk $
To read the documentation on object elevation_grid, write the following sentence:
describe(elevation_grid) $
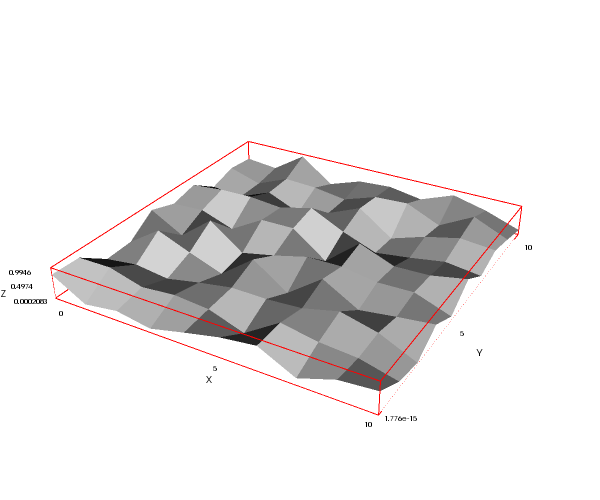
A random matrix:
m: apply(matrix, makelist(makelist(random(1.0),k,1,10),i,1,10)) $

draw3d(
  color = white,
  elevation_grid(m, 0, 0, 10, 10)) $

Local option wired_surface on an elevation_grid object:
m: apply(
        matrix,
        makelist(makelist(random(1.0),k,1,10),i,1,10)) $

draw3d(
    enhanced3d    = true,
    wired_surface = true,
    elevation_grid(m,0,0,3,2)) $

Modules:
m: apply(
      matrix,
      makelist(makelist(mod(k,i),k,1,20),i,1,20)) $

draw3d(
  enhanced3d = true,
  elevation_grid(m, 0, 0, 20, 20)) $

An artificial landscape. The simulation may take a while, be patient:
terrain_generator(m) :=
    block([terra: float(zeromatrix(m,m)), iter:100, x, y, slope],
        for k:1 thru iter do(
            [x, y]: 1 + [random(m), random(m)],
            slope: tan(random(180.0)),
            for i:1 thru m do
                for j:1 thru m do
                    if i < slope * (j-x) + y
                        then terra[i,j]: terra[i,j] + iter/k
                        else terra[i,j]: terra[i,j] - iter/k  ) ,
        terra / iter) $

terreno: terrain_generator(100)$

draw3d(
  enhanced3d = true,
  palette    = gray,
  elevation_grid(terreno, 0, 0, 10, 10)) $

Lena. We read a list of 40000 gray levels and transform it in a square matrix of order 200:
m1: read_list("lena.txt")$

lena: apply(matrix, makelist(makelist(m1[j],j,k*200+1, k*200+200),k,0,199)) $

draw3d(
  palette    = gray,
  enhanced3d = true,
  elevation_grid(lena/10.0,1,1,100,100)) $

2D Fast Fourier Transform. Contributed by Edward G. Montague (thanks):
/* Load FFT package */
load(fft)$

N:128$
M:128$

/* 2d  fft
   input array a2
   output array b2 */
fft2(a2,b2):=
    block(
        local(i,j,n,m,ab),
        ab: arrayinfo(a2),
        n: ab[3][1],
        m: ab[3][2],
        n: n+1,
        m: m+1,
        array(b1, float, n-1),
        fillarray(b1, [0.0]),
        for j:0 thru m-1 do (
            for i:0 thru n-1 do
                b1[i]: a2[i,j],
            bb: listarray(b1),
            cc: fft(bb),
            for i:0 thru n-1 do
                b2[i,j]: cc[i+1]),
        kill(b1,cc,i,j),
        array(b1,float,m-1),
        fillarray(b1,[0.0]),
        for i:0 thru n-1 do (
            for j:0 thru m-1 do
                b1[j]: b2[i,j],
            bb: listarray(b1),
            cc: fft(bb),
            for j:0 thru m-1 do
                b2[i,j]:cc[j+1]),
        b2 )$

/* Exchange 2d array values for centered spectrum .
   Input array   b2
   Output array  c2*/
vxchg(b2,c2) :=
    block(
        local(i,j,n,m,i1,j1,ab),
        ab: arrayinfo(b2),
        n: ab[3][1],
        m: ab[3][2],
        n: n+1,
        m: m+1,
        array(b1,float,m-1),
        array(x2,float,m-1),
        fillarray(b1,[0.0]),
        fillarray(x2,[0.0]),
        xb: listarray(x2),
        for i:0 thru n-1 do (
            for j:0 thru m-1 do
                b1[j]: b2[i,j],
            bb: listarray(b1),
            for j:1 thru m/2 do (
                i1: j+(m/2),
                xb[j]: bb[i1],
                xb[i1]: bb[j]),
            for j:0 thru m-1 do
                c2[i,j]:xb[j+1]),
        kill(b1,bb,cc,x2,xb,i,j),
        array(b1,float,n-1),
        fillarray(b1,[0.0]),
        array(x2,float,n-1),
        fillarray(x2,[0.0]),
        xb: listarray(x2),
        for j:0 thru m-1 do(
            for i:0 thru n-1 do
                b1[i]:c2[i,j],
            bb:listarray(b1),
            for i:1 thru n/2 do (
                j1: i+(n/2),
                xb[i]: bb[j1],
                xb[j1]: bb[i] ),
            for i:0 thru n-1 do
                c2[i,j]:xb[i+1]),
        c2 )$

/* Dimension arrays and generate data */
array(a2,float,N-1,M-1)$
array(b2,float,N-1,M-1)$
array(c2,float,N-1,M-1)$
fillarray(a2,[0.0])$
fillarray(b2,[0.0])$
fillarray(c2,[0.0])$
for j:0 thru (M/4)-1 do
    for i:0 thru (N/8)-1 do
        a2[i,j]: 1 $

/* Generate 2d matrix from 2d array .
   Input  array   a2
   Output matrix  Mat1 */
Mat1: genmatrix(a2,N-1,M-1)$

/* 2d  fft
   Input array   a2
   Output array  b2 */
b2: fft2(a2,b2)$

/* Absolute value of 2d array b2.
   Input array  b2
   Output array b2 */
for i:0 thru N-1 do
  for j:0 thru M-1 do
      b2[i,j]: abs(b2[i,j]) $

/* Exchange values.
   Input array   b2
   Output array  c2 */
c2: vxchg(b2,c2)$

/* Generate 2d matrix from 2d array.
   Input  array  c2
   Output matrix Mat2 */
Mat2: genmatrix(c2,N-1,M-1)$

/* Draw the two matrices */
set_draw_defaults(
        enhanced3d = [log(10000*z+1)/log(10001), x, y, z],
        palette    = [4,-10,17])$
draw(
    dimensions = [800, 400],
    columns    = 1,

    /* Draw 2d matrix , Mat1, with logarithmic colouring.
       This is the 2d function data. */
    gr3d(elevation_grid(Mat1, 0, 0, 10, 10)),

    /* Draw 2d matrix, Mat2, with logarithmic colouring.
       This is the centered spectrum */
    gr3d(elevation_grid(100*Mat2, 0, 0, 10, 10)) )$

Isolines on an elevation_grid surface.
m: matrix(
    [ 0.0, 0.0, 9.5,21.0, 10.5, 0.0, 0.0, 0.0, 0.0, 0.0],
    [ 0.0, 2.1, 2.1, 0.0, 52.5,10.5, 6.3, 0.0, 0.0, 0.0],
    [ 0.0, 2.1, 9.5,10.5, 63.0,21.0,27.3,10.5, 0.0,21.0],
    [ 0.0, 0.0, 9.5,42.0, 94.5,52.5,33.6,21.0,31.5,10.5],
    [21.0,52.5, 6.0,94.5,115.5,73.5,67.2,63.0,21.0, 0.0],
    [10.5,42.0,42.0,52.5, 73.5,84.0,42.0,42.0,10.5, 0.0],
    [ 0.0, 0.0,10.5,31.5, 21.0,42.0,54.6,63.0,31.5, 0.0],
    [ 0.0, 0.0, 0.0, 0.0,  0.0, 0.0,23.1,42.0,31.5,10.5],
    [ 5.3, 3.0, 0.0, 0.0,  0.0, 0.0, 6.3,10.5, 0.0, 0.0],
    [18.2,16.4, 0.0, 0.0,  0.0, 0.0, 6.3,10.5, 0.0, 0.0]) $

draw3d(
  enhanced3d = [z,x,y,z],
  isolines   = [x-y*z,x,y,z],
  line_width = 3,
  elevation_grid(m,1,1,100,100)) $

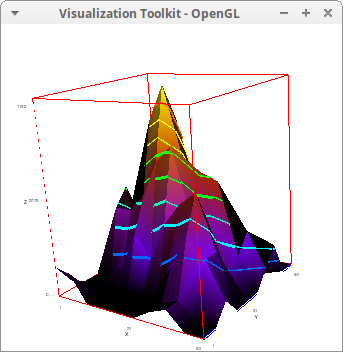
Another example of an elevation_grid surface. This time, we read a list of 8100 heights and transform it in a square matrix of order 90.
m2: read_list("terrain.txt")$

terr: apply(matrix, makelist(makelist(m2[j],j,k*90+1, k*90+90),k,0,89)) $

draw3d(
  enhanced3d = [z,x,y,z],
  isolines   = [z,x,y,z],
  line_width = 2,
  elevation_grid(terr,1,1,100,100)) $

The Mandelbrot set as an elevation grid. A kind contribution from Edward Montague.
MandelB(c,niter):=block([n:0,z:0],
  while ((abs(z) < 4) and (n < niter)) do (
      z:z*z+c,
      z:expand(z),
      n:n+1 ),
  n )$

compile(MandelB)$

nd:200$

x1:-2.5$
y1:-1.5$
x2:1.5$
y2:1.5$
dx:(x2-x1)/nd$
dy:(y2-y1)/nd$

declare(u,complex)$
declare(niter,integer)$
declare(i,integer)$
declare(j,integer)$
declare(m,integer)$
a1:zeromatrix(nd+1,nd+1)$

niter:80$

j:1$
for y:y1 thru y2 step dy do(
  i:1,
  for x:x1 thru x2 step dx do (
        c:x+%i*y,
        m:MandelB(c,niter),
        a1[i,j]:m,
        i:i+1 ),
  j:j+1 )$

load("draw") $
draw_renderer: 'vtk $

draw3d(
  enhanced3d = true,
  elevation_grid(a1*0.4, 1, 1, nd, nd)) $

This is another example of a 3D fractal, a contribution by Tomio Arisaka. This example also shows how to integrate a user defined Lisp function stored in an external file, mandelbrot-julia.lisp, into a Maxima session. The Javascript code for the interactive visualization is based on the ThreeJS library.
The elevation-grid object is exported to the ply format by means of the terminal option.
load("./mandelbrot-julia.lisp") $

/* example of Julia set */
scale : 120.0 $
iteration : 40 $
[x0, y0] : [0.3090169943749475, -0.535233134659635] $
[x1, x2, y1, y2] : [-1.2, 1.2, -1.4, 1.4] $
width : abs (x2 - x1);
hight : abs (y2 - y1);
size_x : round (width * scale);
size_y : round (hight * scale);
ma1 : zeromatrix (size_y, size_x) $
?julia\-set1 (ma1, iteration, x0, y0, x1, x2, y1, y2);

draw3d(
  terminal   = ply,
  enhanced3d = true,
  palette    = [10, 17, 10],
  elevation_grid(ma1*float(1/(iteration*2*2)), x1, y1, width, hight)) $
The necessary Javascript code looks as follows:
<div id="ThreeJS"></div>

<script>
var container, scene, camera, renderer, controls, sky;

init();
animate();

function init() {

    scene = new THREE.Scene();
    var width  = screen.width;
        height = screen.height;

    camera = new THREE.PerspectiveCamera(50, width / height, 1, 20000);
    camera.position.set(2,2,2);
    scene.add(camera);

    renderer = new THREE.WebGLRenderer();
    renderer.setSize(width, height);

    container = document.getElementById( 'ThreeJS' );
    container.appendChild( renderer.domElement );

    controls = new THREE.TrackballControls(camera, renderer.domElement);
    controls.rotateSpeed = 5.0;

    var light = new THREE.PointLight(0xffffff);
    light.position.set(100,250,100);
    scene.add(light);

    var light = new THREE.PointLight(0xffffff);
    light.position.set(-200,-150,-300);
    scene.add(light);

    var skyBoxGeometry = new THREE.CubeGeometry( 10000, 10000, 10000 );
    var skyBoxMaterial = new THREE.MeshBasicMaterial({color: 0xccccff,
                                                      side: THREE.BackSide});
    sky = new THREE.Mesh( skyBoxGeometry, skyBoxMaterial );
    scene.add(sky);

    var loader = new THREE.PLYLoader();
    loader.load( 'maxima_out.ply',
                 function ( geometry ) {
		    geometry.computeFaceNormals();
		    var material = new THREE.MeshPhongMaterial( {
						color: 0xff5533,
						specular: 0x111111,
						shininess: 200,
						side: THREE.DoubleSide } );
		    var mesh = new THREE.Mesh( geometry, material );
		    mesh.position.set( 0, 0, 0 );
		    mesh.rotation.set( 0, - Math.PI / 2, 0 );
		    mesh.castShadow = true;
		    mesh.receiveShadow = true;
		    scene.add( mesh ); } ); }

function animate() {
   requestAnimationFrame(animate);
   renderer.render(scene, camera);
   controls.update(); }

</script>
May take a little while to read the 3.7MB file. Please, be patient.
© 2011-2018, TecnoStats.