Once you have opened a Maxima session, load package draw and then set global variable draw_renderer to vtk:
load("draw") $
draw_renderer: 'vtk $
Prisms are defined by the center (midpoint of its height), number of lateral faces, the coordinates of any point situated on a line containing a lateral edge, height, and direction. This scene is exported to VRML format, with WRL extension, and visualized with help of the three.js Javascript library. You need a modern browser to interact with the objects:
draw3d(
  terminal = vrml,
  color    = gold,
  capping  = true,
  prism([1,1,1],8,[2,0,0],4,[0,0,0]),
  color    = gray,
  capping  = [true,false],
  prism([0,0,0],5,[1,3,2],2,[1,2,-6]) ) $
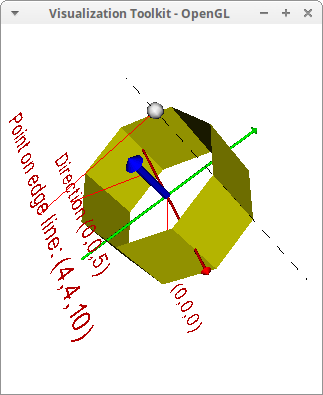
For a better understanding of the arguments, run this code:
draw3d(
    head_length      = 0.5,
    line_width       = 0.1,
    axis_3d          = false,

    /* x- axis */
    color            = red,
    vector([-8,0,0],[16,0,0]),

    /* y- axis */
    color            = green,
    vector([0,-8,0],[0,16,0]),

    /* z- axis and direction vector */
    color            = blue,
    line_width       = 0.3,
    head_length      = 1,
    vector([0,0,0],[0,0,5]),

    /* the prism */
    color            = yellow,
    prism([0,0,0],8,[4,4,10],6,[0,0,5]),

    /* edge and edge point */
    point_type       = sphere,
    color            = white,
    points([[4,4,10]]),

    line_width       = 1,
    points_joined    = true,
    point_type       = dot,
    line_type        = dashes,
    color            = black,
    points([[4,4,13],[4,4,-13]]),

    /* labels and indicators */
    color            = red,
    font_size        = 1,
    point_type       = dot,
    line_width       = 1,
    line_type        = solid,

    label(["Center (0,0,0)", -5, -5, -8]),
    points([[0, -5, -8], [0, 0, 0]]),

    label(["Direction (0,0,5)", -5, -5, 5]),
    points([[0, -5, 5], [0, 0, 3]]),

    label(["Point on edge line: (4,4,10)", -5, -5, 10]),
    points([[5, -5, 10], [4, 4, 10]])  ) $

© 2016, TecnoStats.